Led UX for an enterprise analytics & ads platform. 3 phases shipped, AI agents built in
I led UX for the redesign of Insights, LG Ad Solutions’ measurement platform. All three phases shipped, with AI agents from Agentiv built in.
Role
UX Lead
Team
Product, business & front-end
Timeline
Mar 2025 – Mar 2026
Platform
Web
Status
3/3 phases in production
Tools
Figma, FigJam, Figma Make
01
Context & opportunity
Why it mattered
A global leader in advanced advertising for connected TV and cross-screen devices. Through a worldwide network of LG Smart TVs, it gives advertisers and content creators broad reach and targeted engagement on the largest screen in the home.
Measurement is how Sales proves a campaign worked across linear TV, connected TV and the LG home screen, and how clients decide to buy again. But Insights, the legacy platform for it, was built years earlier for linear TV attribution, and it never caught up with the business.
Who it’s forShow 5 items
Advanced Reporting
The main stakeholder, and the first phase: the homepage and report requests.
Ad Ops
Request and run campaign reports; they tested the prototype and the MVP.
Sales & Account Management
Need to prove a campaign’s ROI to clients.
Programmatic
Had its own implementation of the same reports; the third phase.
Resellers & clients
External users, part of the 37 interviews.
02
Problem & discovery
What we needed to understand
I interviewed 37 people across seven internal teams (Advanced Reporting, Ad Ops, Programmatic, Sales, Account Management, Business Intelligence and Measurement), plus resellers and clients. Five themes kept coming back: hard to navigate, no way to prove ROI, slow with large datasets, fragmented data, and too little granularity.
Underneath were engineering constraints. Managed Service and Programmatic had separate implementations of the same report, and extending a single report module took months.
How it worked before
Fixed report template
Built twice, once per business line
Months to add a module
Every change to a report went back to engineering.
What kept coming back
“I can’t find the report I need.”
“I can’t prove ROI to my client.”
Same report, two separate builds.
Months to add one module.
03
Strategy & direction
What I decided and why
Decision 1Shipped
Modular reports instead of fixed templates
The tension
Every report type was a fixed template, built twice (once per business line) and slow to change.
Options I ruled out
Keep fixed templates and add more. It multiplied engineering work and still couldn’t fit each campaign’s goals and audiences.
What I chose
Build every report from modules, each a chart plus an editable key takeaway. Users pick them when they request a report, then edit, copy or remove them.
Trade-off
More choices when requesting a report. In testing, experienced users went straight to a standard tier while newer ones got lost in the options, which shaped the iterations that followed.
Result
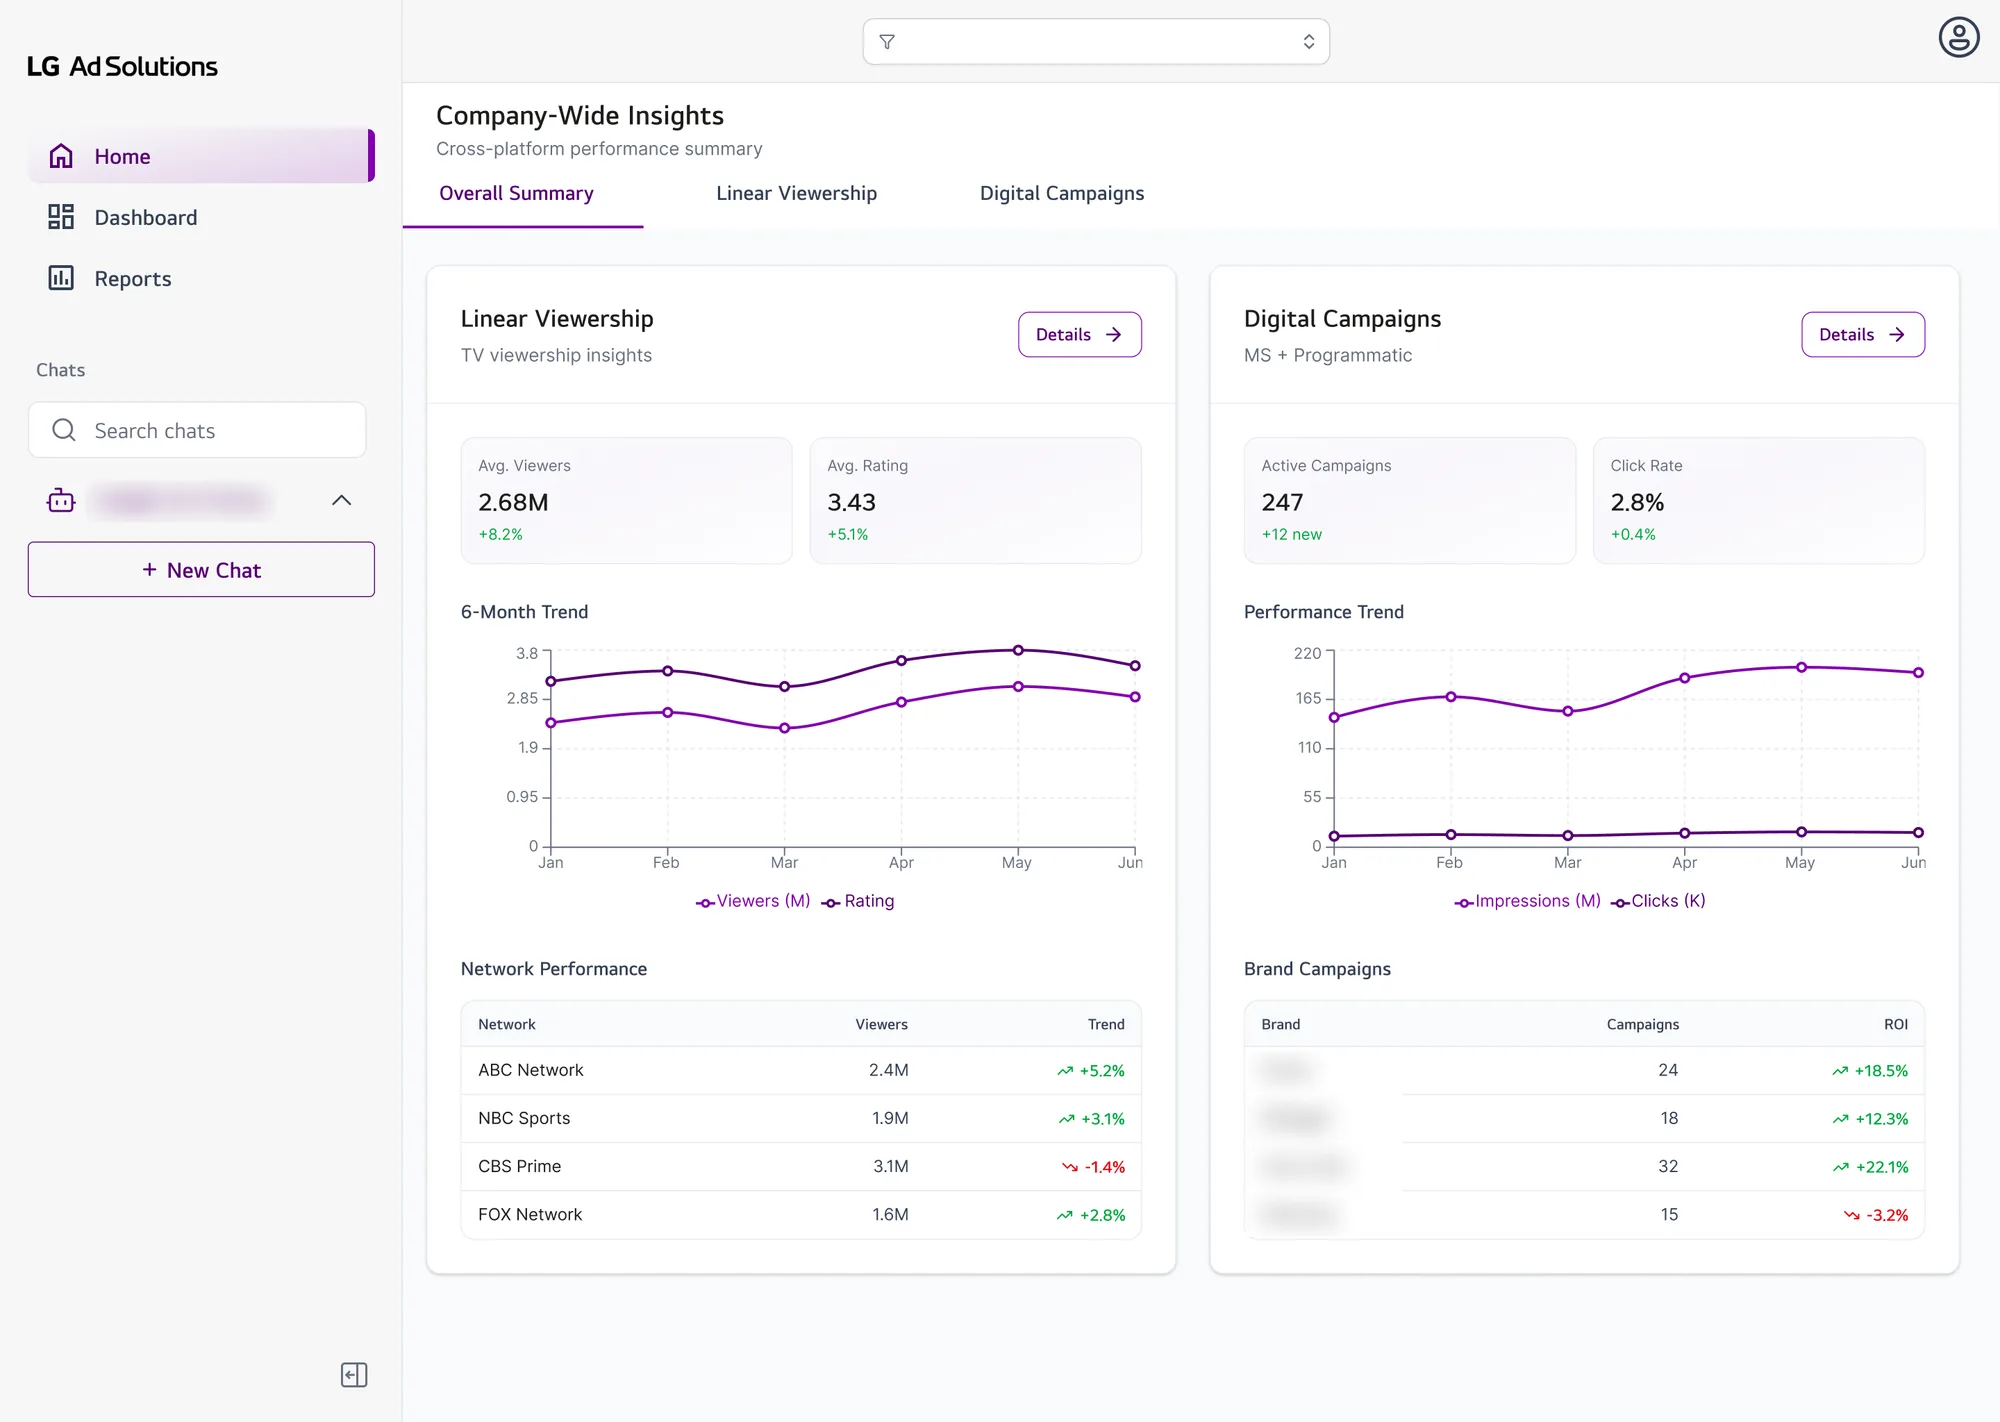
One system behind reports, the homepage and dashboards.
Decision 2Shipped
One assistant across the product, not a separate chatbot
The tension
The product needed an AI layer, and the open question in reviews was where it should live.
Options I ruled out
A single chatbot in the menu. Users would have had to leave their context to ask about the data in front of them.
What I chose
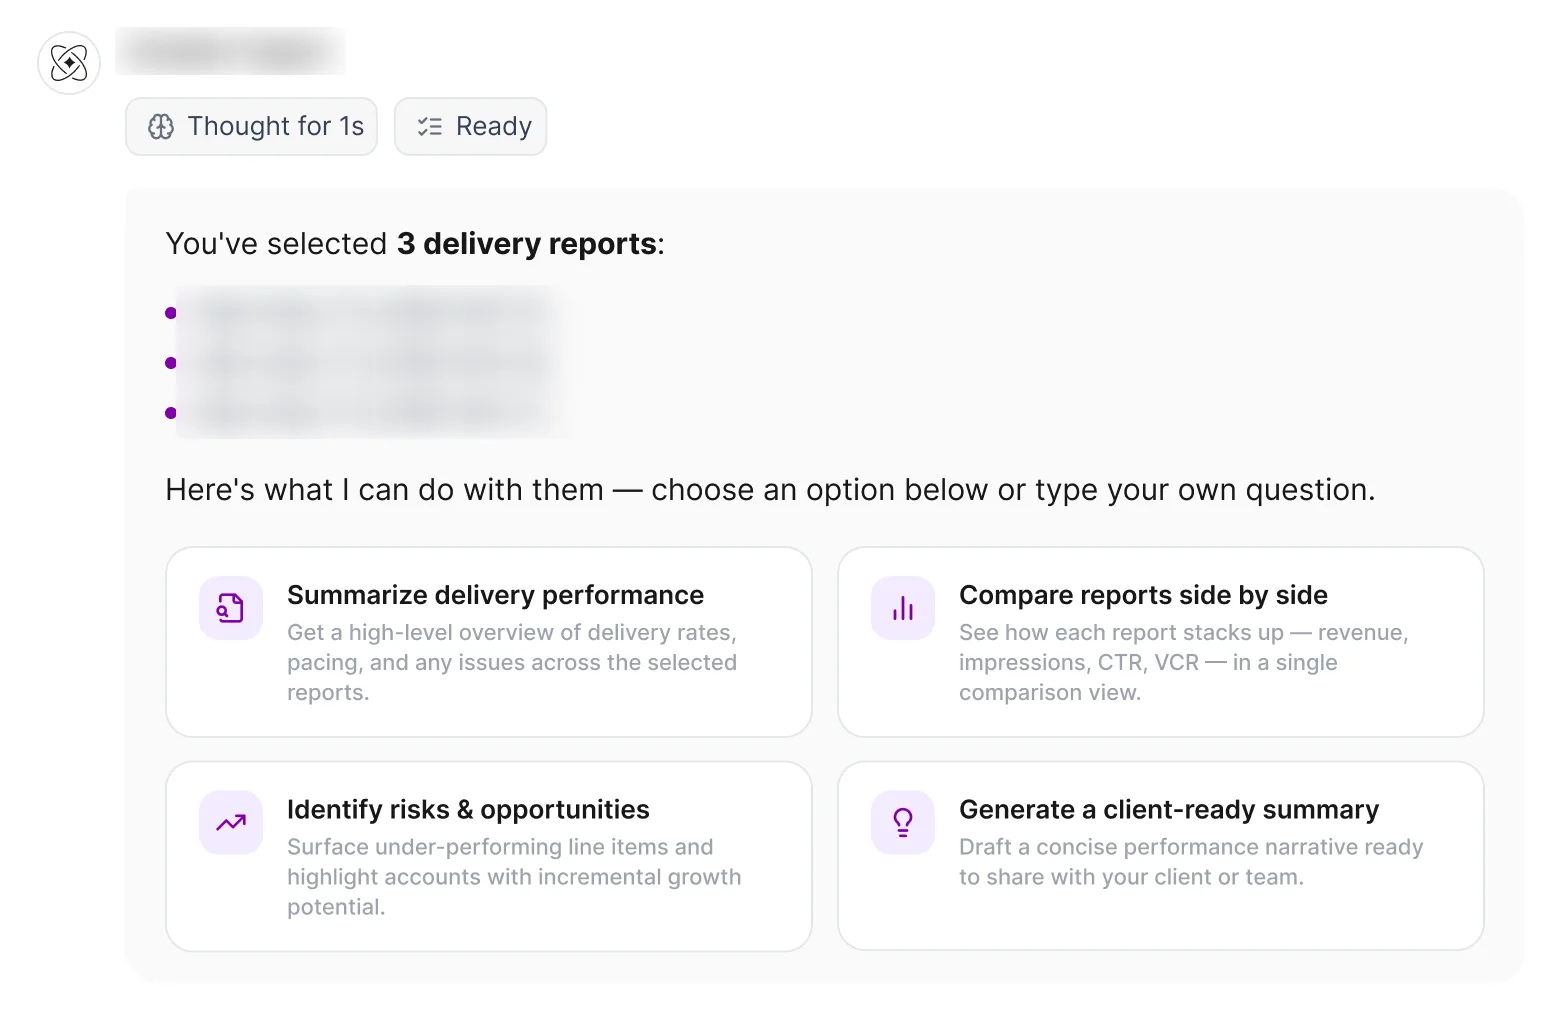
Make the assistant available from Home, Dashboards and Reports, aware of what the user is looking at, and able to add the charts it creates back to the homepage.
Trade-off
The assistant is only as good as the data, so it started with insight curation, where the data was most reliable.
Result
Shipped. In use, managers couldn’t follow what the agent was doing, so I redesigned its steps as a readable progress view.
Decision 3Shipped
People stay in control of what clients see
The tension
The AI could pre-select what to report for each client, but inaccurate reports were already a trust problem.
Options I ruled out
Fully automatic curation. Faster, but analysts need to check every number before it reaches a client.
What I chose
AI curation is optional, and every key takeaway stays editable.
Trade-off
A few extra steps for analysts, in exchange for reports they can stand behind.
Decision 4Shipped
Ship by stakeholder, not all at once
The tension
Data-quality issues upstream had to be fixed first, and each team needed something different.
Options I ruled out
A big-bang redesign. It would have waited on every data fix and delayed value for everyone.
What I chose
Phase 1 for Advanced Reporting (homepage and report requests), Phase 2 for dashboards, Phase 3 for Programmatic reporting.
Trade-off
Some teams waited longer: Programmatic came last.
Result
All three phases reached production.
04
Design & validation
How the solution evolved
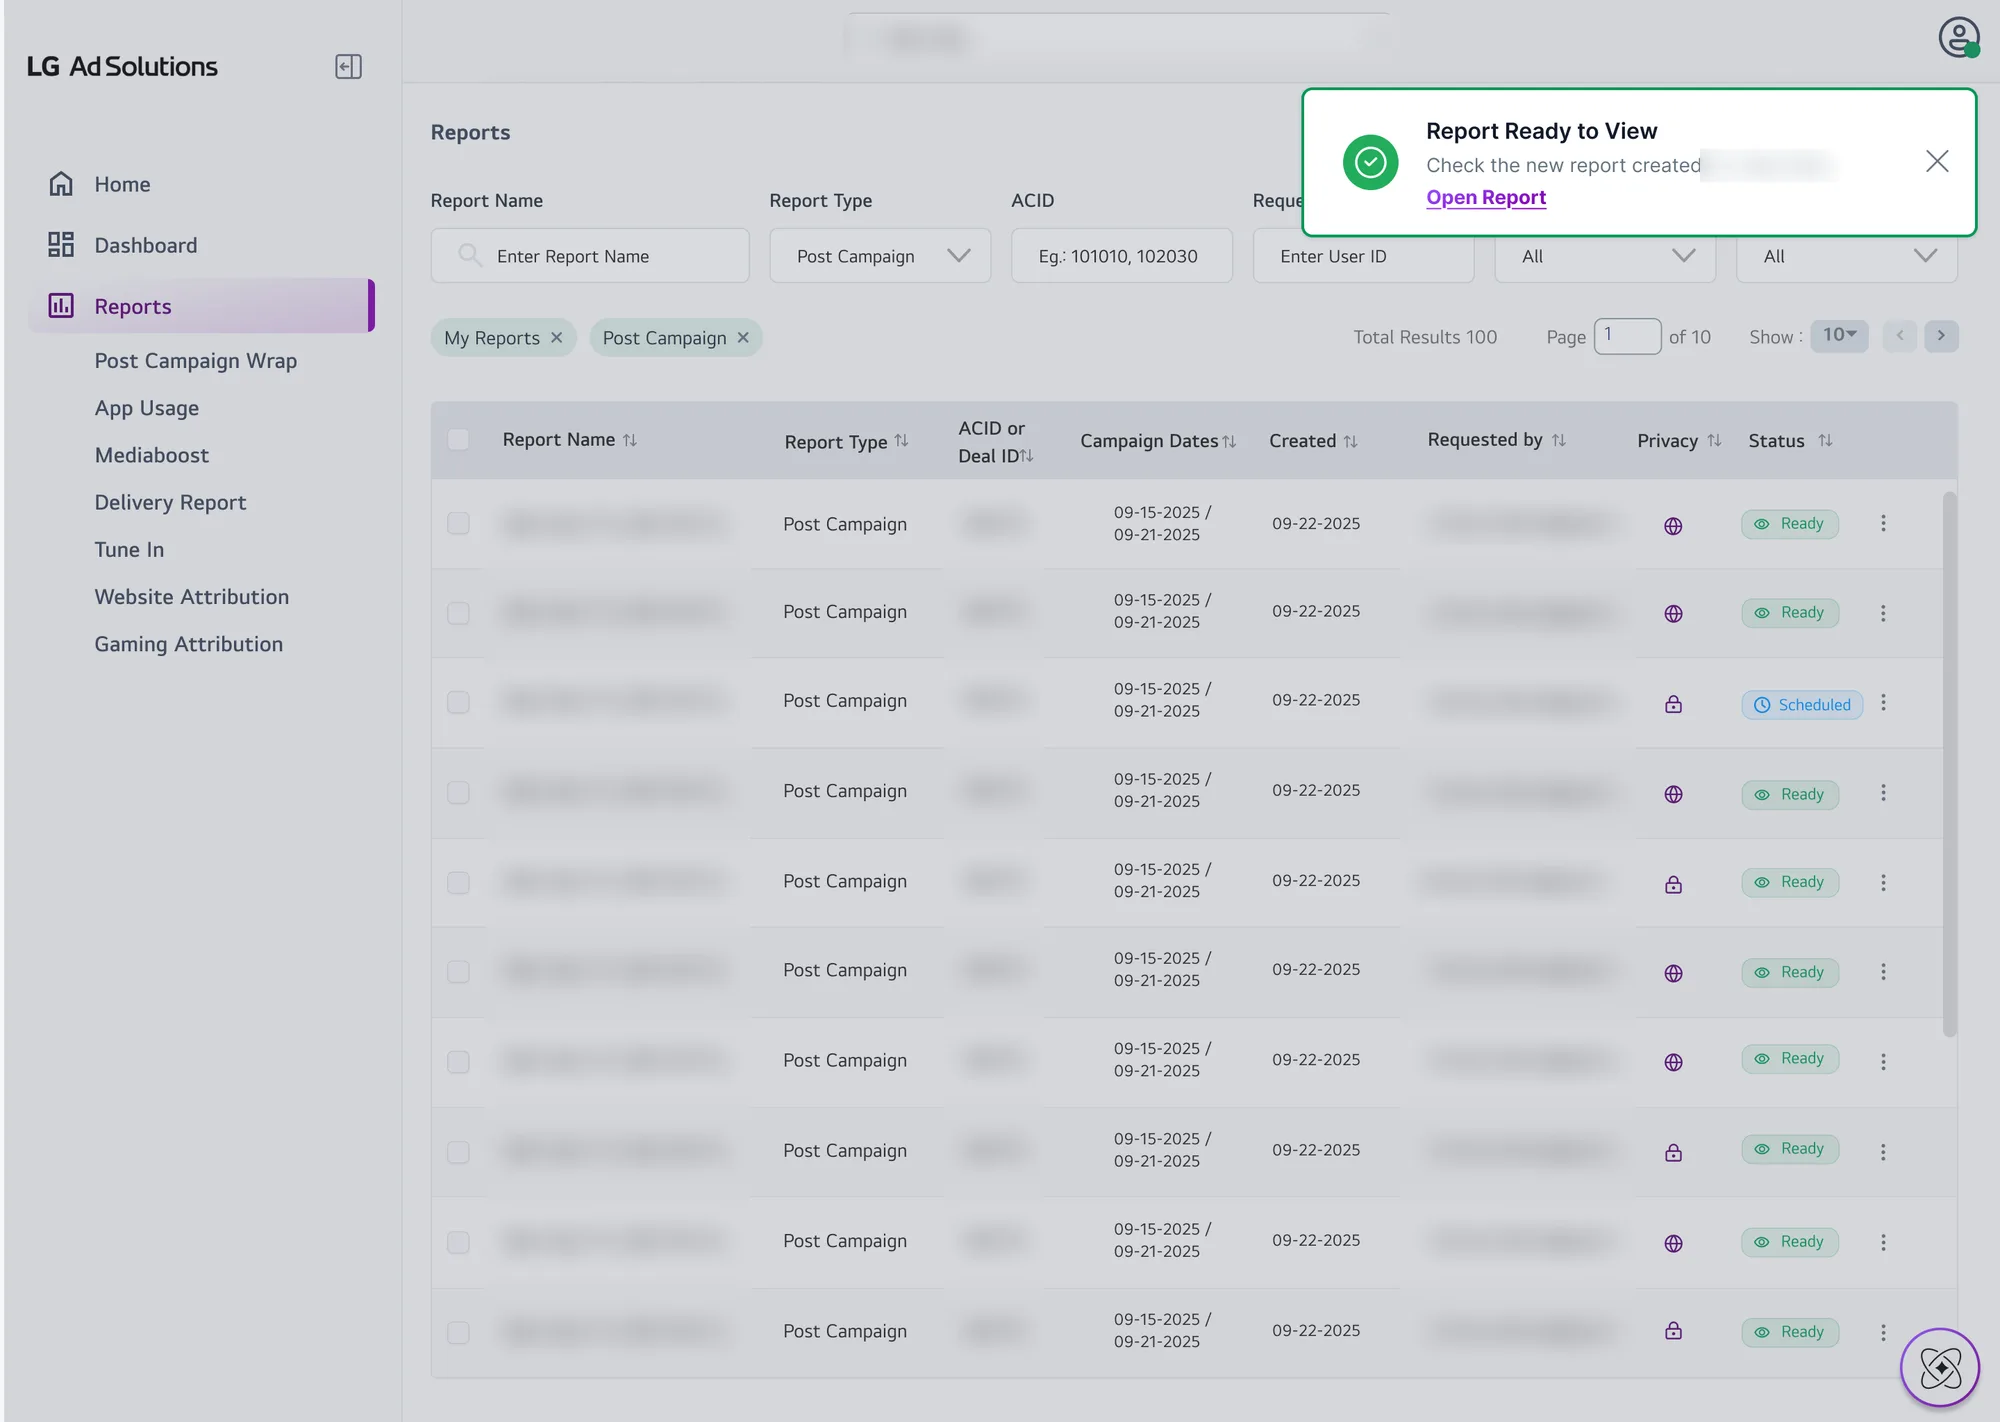
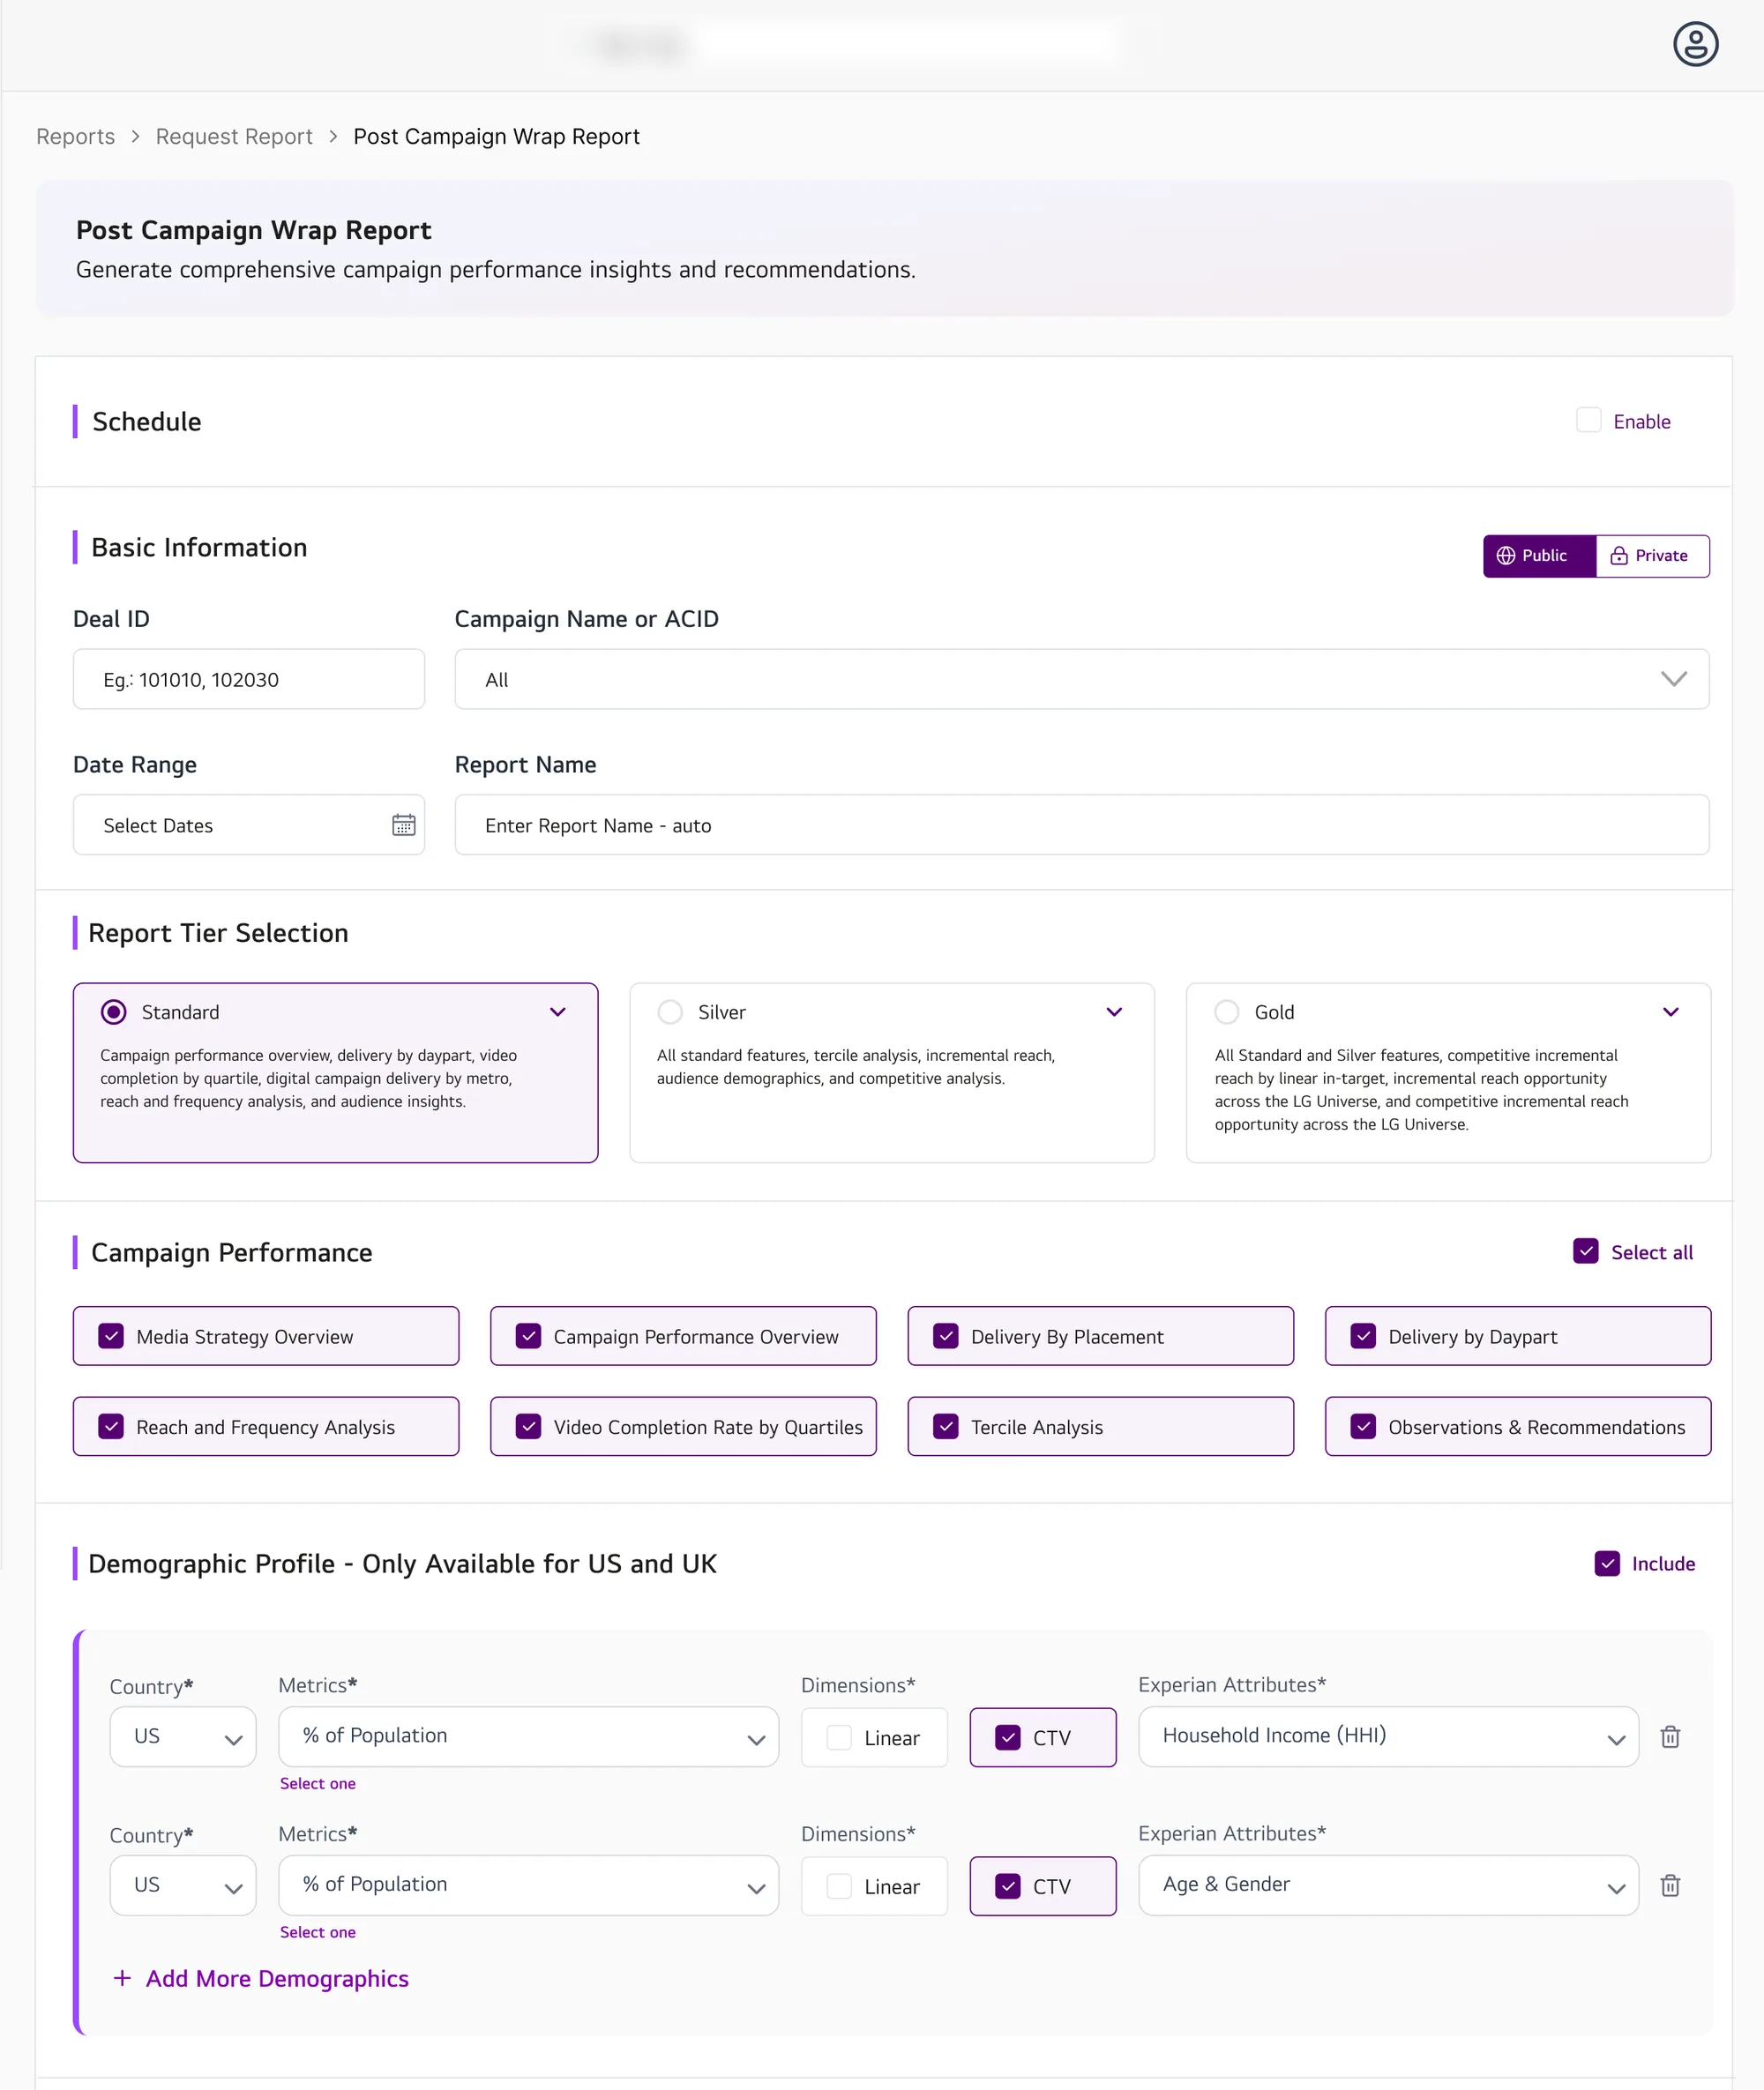
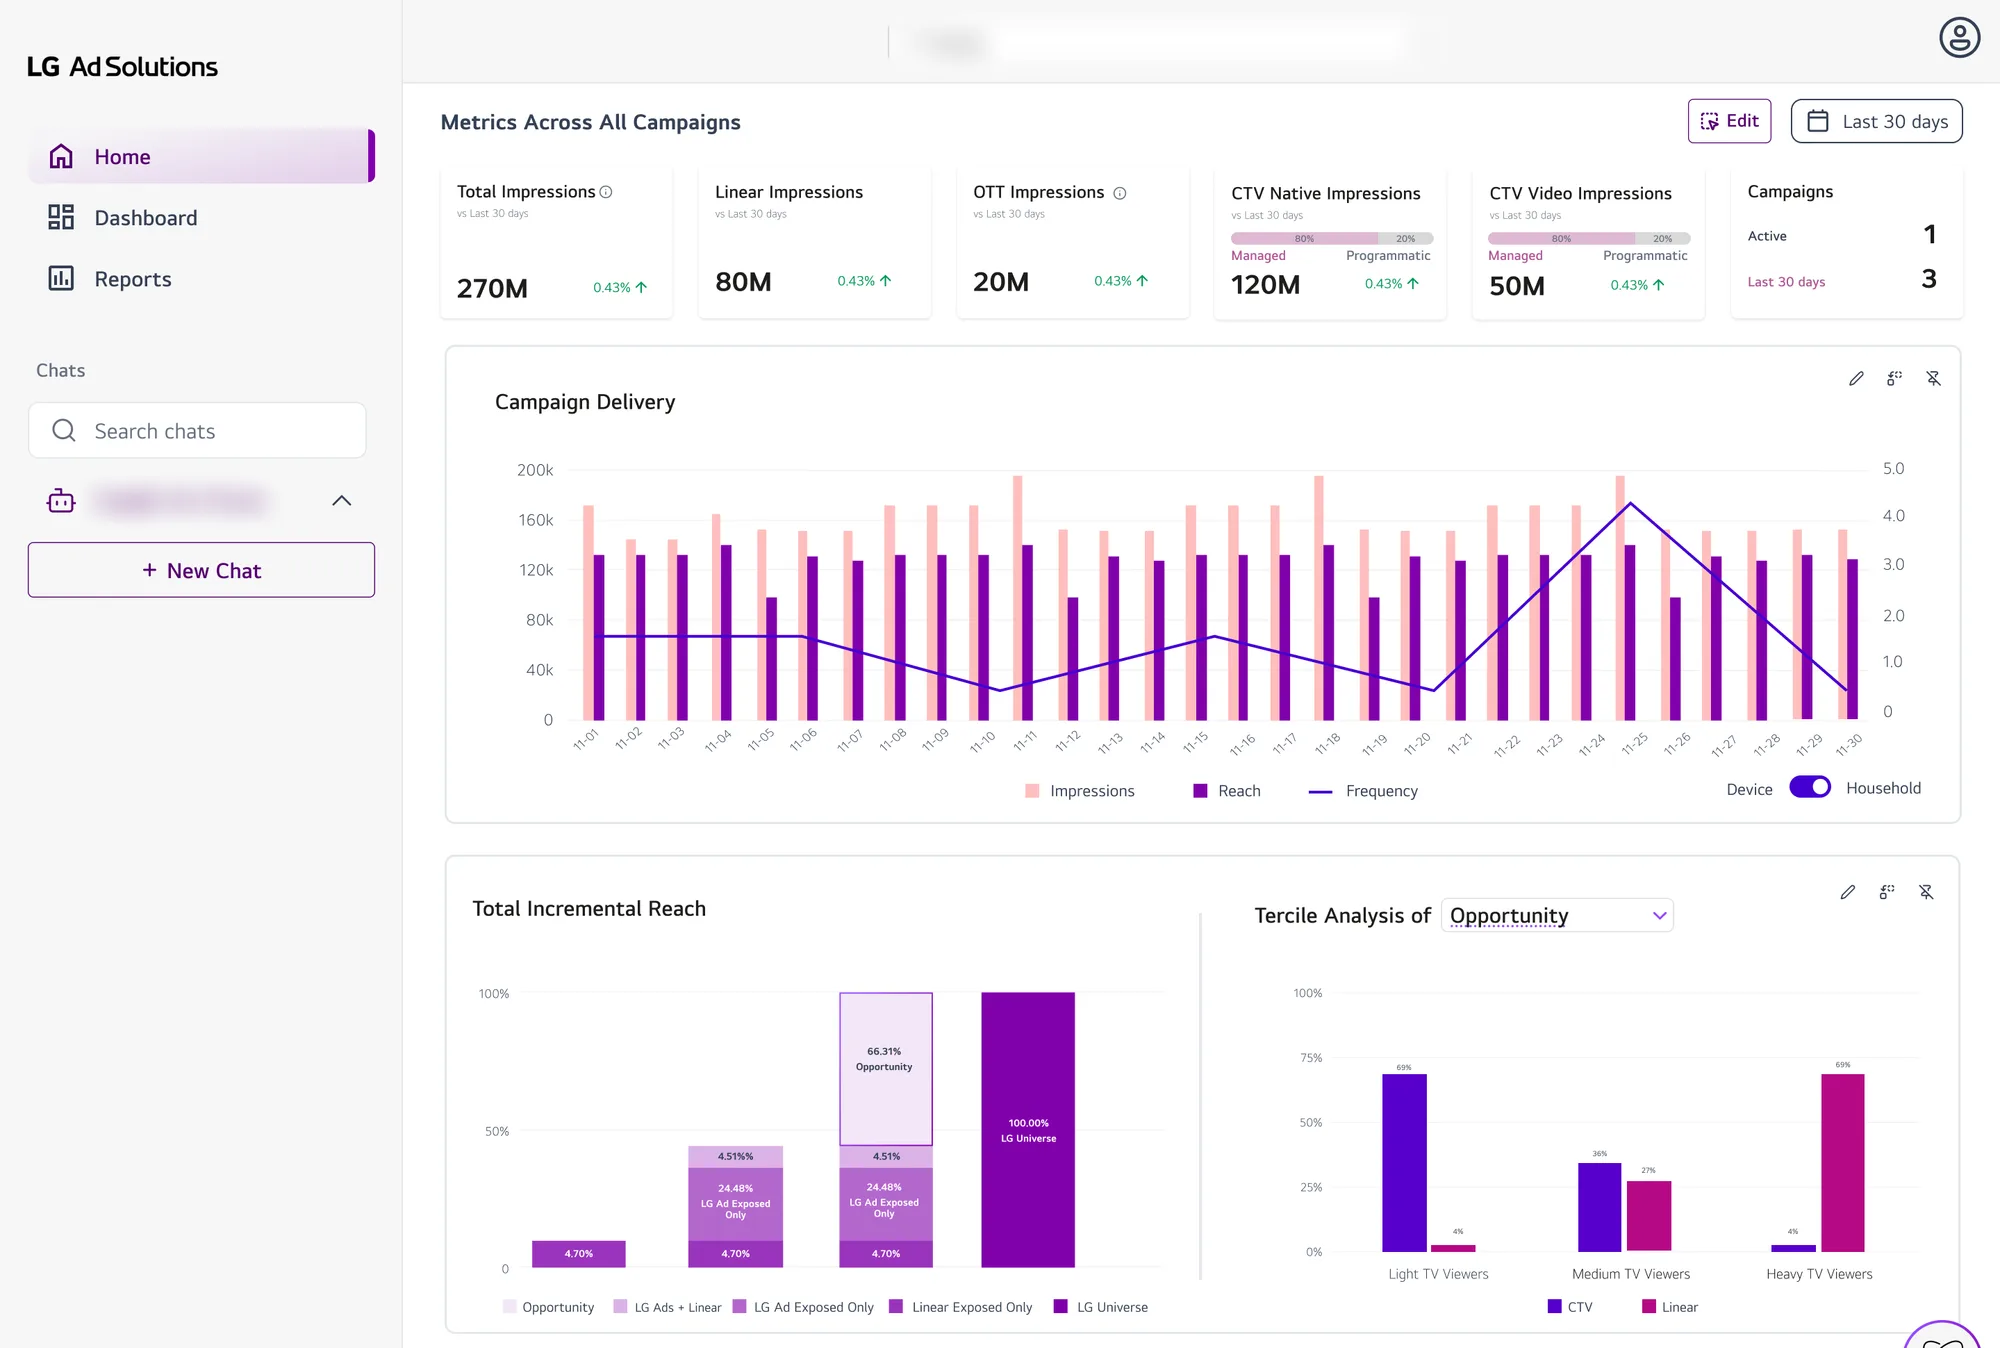
A redesign of the legacy platform, updated with AI: agents from Agentiv, LG Ad Solutions’ AI platform (where more than 20 agents support workflows across the business), now work inside it. At its core is a report system built from modules: users request a report by choosing a tier and the modules they need; it runs in the background and they’re notified when it’s ready. The same modules make up the homepage and dashboards, and the AI assistant reads and creates them.
Around 400 high-fidelity screens, a component library shared with front-end, and user flows that mapped the unhappy paths before any UI.
Report modules
Report tiers
Dashboards
AI assistant
123
Tiers preselect modules, so nobody starts from a blank form.
Modules are plain checkboxes: add, remove or select all.
Demographic data only exists for the US and UK, and the form says so before you request.
The homepage uses the same modules as reports, each with its own actions.How each decision was testedShow 4 items
Modular reports instead of fixed templatesShipped
Inflexibility was one of the five interview themes. Reviewed with product and engineering through the PRD, then tested with Ad Ops on the prototype and the MVP.
One assistant across the product, not a separate chatbotShipped
Mapped in the user flows with product, then tested with users.
People stay in control of what clients seeShipped
Written into the PRD as a hypothesis to test with users.
Ship by stakeholder, not all at onceShipped
Sequenced with product around data readiness and stakeholder priority.
05
Execution & collaboration
How it got built
What I owned
Discovery with 37 interviews, personas and journeys, the PRD with two Product Managers, user flows, the modular report system, around 400 high-fidelity screens, and the prototypes we tested with Ad Ops.
What others did
Product owned scope and priorities, and front-end engineering built it. The Agentiv design system I created with another designer; for Insights I added new components and colour styles.
Setup
UX Lead · Clear Tech for LG Ad Solutions · Mar 2025 – Mar 2026
Design system
Insights is built on a new design system for Agentiv, created with another designer and shared with front-end. For Insights, I added new components and colour styles, so every report, dashboard and AI answer is built from the same parts.
What it’s made ofShow 5 items
Report modules
A chart plus an editable key takeaway: the unit that reports, the homepage and dashboards are made of.
Report tiers
Standard, Silver and Gold preselect modules, so a request never starts from a blank form.
Statuses
Pending, Ready, Scheduled and Error badges, used the same way across every list.
Colour styles
New colour styles created for Insights.
Interactive components
Forms, date-range selectors, menus, modals, tooltips and a collapsible sidebar.
Edge cases, designed up frontShow 7 items
A report is slow or fails
Pending, Ready and Error statuses, plus a notification when it’s ready.
One person, many clients
Each client is a separate partitioned space, with a client switcher.
Data that only exists in some markets
Demographics run only for the US and UK, and the form says so up front.
Two business lines, two kinds of ID
Search and sort by campaign ID or by deal ID.
Incomplete requests
A minimum to submit: one campaign, a report name and who can see it.
Reports that don’t match
Combining reports with different dimensions shows an “Incompatible reports selected” warning.
The AI is working, or fails
Step-by-step progress, loading and error states, and a Stop action.
06
Impact & learnings
What changed and what comes next
3/33/3
Phases shipped
Homepage and reports, dashboards and Programmatic, with Agentiv agents built in.
3737
Interviews
Seven internal teams, plus resellers and clients.
~400~400
High-fidelity screens
Plus a component library shared with front-end.
Impact by dimension
User
Tested with Ad Ops on the prototype and the MVP. The agent’s steps were redesigned so managers can follow them.
Business
3/3 phases in production, with Agentiv agents built in.
Operational
One module system behind reports, the homepage and dashboards, instead of templates built twice.
Before and after
What changed
Before
After
Reports
Fixed templates, changed by engineering
Modules users choose, edit, copy or remove
Requesting a report
One template per report type
Tiers that preselect the right modules
Asking questions of the data
Not possible in the product
An AI assistant in Home, Dashboards and Reports
I left in March 2026, before post-launch numbers came in. Success was defined up front as fewer reporting errors, client retention and active use.
In the press
Agentiv provides a unified platform for developing and deploying agents across multiple business functions, helping streamline internal processes and strengthen how we collaborate with clients.
With AI, capability isn’t the hard part. Legibility is: people need to see what the agent is doing.
What I learned once the assistant was in people’s hands: capability isn’t the hard part, legibility is. Managers couldn’t follow what the agent was doing, so I redesigned its steps as a readable progress view and made the reasoning quieter and collapsible. And the most common question wasn’t about data at all. It was “what can I do here?”